Purpose of experimentation:
What is an experiment?
Change in Input → Process → change in output
Process → machines, materials, methods, people, environment, measurements
What are the important input factors, and how do they influence the output?
1) Improve performance characteristics:
Identify critical factors
Reduce scrap and rework
2) Reduce costs
3) Shorten production development time
Example system input and outputs for product optimization:
What is experimental design?
Using efficient and effective experimentation procedures to get the most information you can the fastest you can.
Most efficient way to collect data?
.
.
.
.
Use historical or happenstance data
AKA, just use what is already out there.
Risks – undocumented/unknown factors present in non-experimental data.
Example:
Does changing temp in wire bonding process increase the number of defects in the product?
Does changing temp in wire bonding process increase the number of defects in the product?
Undocumented factor:
Lab operator was changing the standard temperature settings without recording altered temperatures.

Hold temperature constant, just change pressure.
Lab operator was changing the standard temperature settings without recording altered temperatures.
.
.
.
Change one factor at a time.
example:
Hold Pressure constant, just change temperature.

Hold temperature constant, just change pressure.
Do the above tables contain all possible combinations of (T,P)?
No (P2,T1) is missing.
What about interactions between factors?
If factors interact with one another,
Example: Testing the effects of heart medication and grapefruit juice on health. (Cannot test grapefruit juice independently of medication, as they interact with one another)
If factors interact with one another,
one-at-a-time testing is inadequate to determine results.

- Works well if there are only a few input factors
- Impossible if there are many input factors
Combination of (P2,T1) is not contained in the one-at-a-time tables. What if (P2,T1) provides the optimal result?

Full Factorial Design
Test all possible combinations of input factors
- Works well if there are only a few input factors
- Impossible if there are many input factors
Example – what if there are 12 different input factors?
12 input factors, each tested at two different values
(T1, T2, P1, P2, % C1, %C2, etc.)
.
State specific goals
Example goals for materials testing -
analyze o-ring materials for use in rocket booster seal. Quantify temperature and loading-rate dependence of material strength properties.
Gather background information through research and meetings
Example Objective:
Create stress-strain diagrams for rubber which shows strength properties as a function of temperature
2^12 combinations = 4096 combinations to test! impossible!
Robust Design:- Eliminate testing factors that cannot be changed or controlled.
- Use statistical tools to determine the most important combinations to test.
Planning your experiment:
State specific goals
Example goals for materials testing -
analyze o-ring materials for use in rocket booster seal. Quantify temperature and loading-rate dependence of material strength properties.
Gather background information through research and meetings
Meet with
- Management,
- engineers,
- subject matter experts,
- operators,
- analysts
- type of rubber
- temperature (room temp, freezing, and room temp)
- loading rate
- age of rubber
- exposure (sun, humidity)
- other treatment options
List of outputs
- yield point,
- young's modulus,
- shape of stress strain curve
- friction coefficient
- Define safe operating temperatures and pressures for o-ring seals
Create stress-strain diagrams for rubber which shows strength properties as a function of temperature
How many levels per input?
possible experiments to run:
Create stress-strain diagrams for 3 different temperatures (frozen, room temp, 100°C)
Test multiple types of o-ring materials
Test old and new o-rings to quantify how properties change with time
test under different pressures
possible experiments to run:
Create stress-strain diagrams for 3 different temperatures (frozen, room temp, 100°C)
Test multiple types of o-ring materials
Test old and new o-rings to quantify how properties change with time
test under different pressures
*1.18 Tree diagram

Taking Data in lab:
Uncertainty Analysis:
Errors in Physical Measurements
Mean:


xi = each individual data point
u = mean
N = number of data points
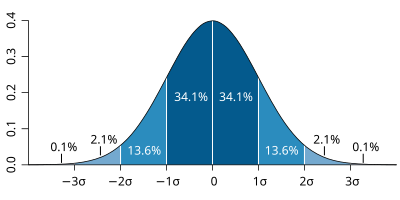
Gaussian (Normal) Distribution,
or common probability distribution.
(Take a bunch of data, probability that data will fall within a certain range)


Pre-Lab HW:
Set up an excel worksheet to take data in lab.
Create tables to record results.
Tables should have
Make a hypothesis about what you will find in lab next week:
Example Experiment:
Create stress/strain diagrams for a rubber band under various loading conditions to quantify its strength properties.
1. Mark volume measurements on a water bottle:
6. Create a stress-strain curve:
Get a new rubber band (same type)
*1.4 Design Matrix Table
Conducting the experiment:
- Adhere to clearly defined and agreed upon operating procedures
- Prepare data sheets in advance
- Repetition & error tolerances
- Analyze data, Draw conclusions, make predictions, do confirmatory tests
Causation vs. Correlation
- A causes B
- B causes A
- A and B are both consequences of the same cause
- Some combination of 1, 2, and 3
- A and B unrelated, correlation is pure coincidence.

Taking Data in lab:
- Repeat each measurement 4 times
- Compare the data you get to the data other teams get - is it repeatable?
- What is the error in measurement?
Uncertainty Analysis:
Errors in Physical Measurements
- X = True Value
- xi = measured value
- n = number of measurements taken
- Accuracy = how close xi is to true value X
- Precision = how good grouping is
Mean:

- Median = midpoint in events (½points below, ½ points above)
- Mode = most frequently occurring value
- Error = ei = Deviation from true value: ei = xi - X
- We do not (and cannot) know X - so - Approximate X by the mean µ
- ei* = xi - µ
- ei* approximates ei and is called an estimator of ei.
- Random deviations: Human errors, normal distribution
- Systematic deviations: Calibration errors
- Relative Error = DX/X -or- = ei/m
- Variance

- Standard Deviation = width of distribution, estimate of average error
- Standard Deviation of Mean (SDOM)
u = mean
N = number of data points
Gaussian (Normal) Distribution,
or common probability distribution.
(Take a bunch of data, probability that data will fall within a certain range)
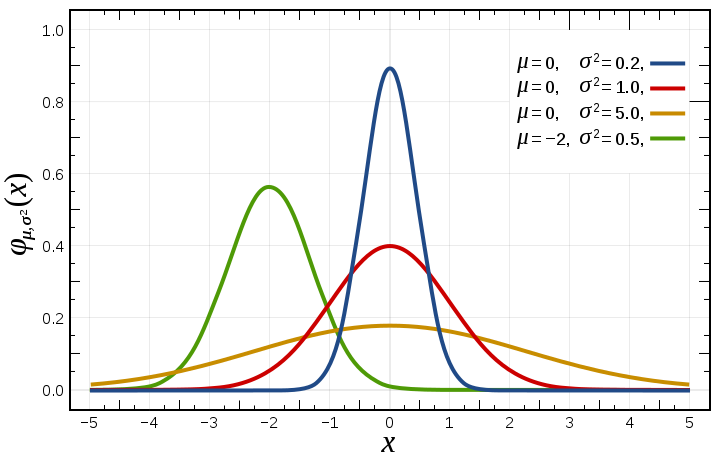
Example of different distributions taken with different precision -

- low standard deviation = data points very close to the mean
- high standard deviation = data points spread out over a large range of values.


Pre-Lab HW:
Set up an excel worksheet to take data in lab.
Create tables to record results.
Tables should have
- Place to record all inputs (material tested, temperature, etc.)
- Room to record multiple trials - repeat each measurement at least 4 times
- Standard deviation, mean, mode for repeated trials
- Room for additional notes and comments.
Make a hypothesis about what you will find in lab next week:
Lab:
It is extremely important that a rubber O-ring retain its material properties under multiple temperatures, pressures, and chemical environments. Your job is to quantify the material performance of rubber.
- What is the yield point of rubber? When does it transition from elastic to plastic deformation?
- Do the strength properties of rubber change with temperature?
- As the rubber becomes older, how does the strength properties change with time?
- If the rubber is brought into contact with water, alcohol, pepsi, nail-polish remover, or other chemicals - how do the properties change?
- How homogeneous is rubber? Are the material properties repeatable and reliable?
Example Experiment:
Create stress/strain diagrams for a rubber band under various loading conditions to quantify its strength properties.
1. Mark volume measurements on a water bottle:
2. Measure the cross sectional area of a rubber band:
3. Hang rubber band from a a doorknob or other hook,
4. Slowly load it by adding water into the water bottle
5. Record how much strain is produced as a function of load
7. Did the rubber band deform linearly? Can you find the young's Modulus?
Repeat experiment:
- Load the new rubber band at the same rate and starting with the same temperature, trying to reproduce as well as you can the original experiment.
- Plot another stress strain diagram for the new set of data
Compare the Young's Modulus of data set, how repeatable is it?
Temperature dependence:
Place rubber band in:
- Boiling Water
- Room Temp
- Ice Water
Does temperature change the material properties of rubber?
Heat Treatment:
Bake some rubber bands in an oven at 300° for 2 hours (simulates rubber band sitting out in the sun)
Create stress-strain diagrams for the heat-treated rubber bands. What does sitting out in the sun do to the strength properties of rubber?
Can you think of any other conditions that need to be tested?
Decide what experiments should be done, what are the inputs of your experiment? What are the outputs? Plan out the experiment, write up procedure, organize data sheets, and don't forget to repeat the experiment to test for uncertainty.


