Start with:
- Title,
- names of authors,
- the institution,
- date
Some reports require an entire title page, others just a header - usually the above information will be needed though.
for 1201 → list the contributions of everyone in your group.
example title page:
Font: Times New Roman, 12 pt or something similar.
Margins: 1" bottom, 1" right
Page numbers:
insert → page number→top, right
Click next to the page number, and look through options in the deign tab. Add the title of your report as a page header by typing it in, and then hitting tab to get it to the corner.
Select "Different First Page" in the design tab to hide the header in the first page.
Hit "Esc" to exit out of the header. Double click on the header to quickly edit it.
Type in a few sections without worrying about formatting yet:
Introduction, Methods and equip, etc.
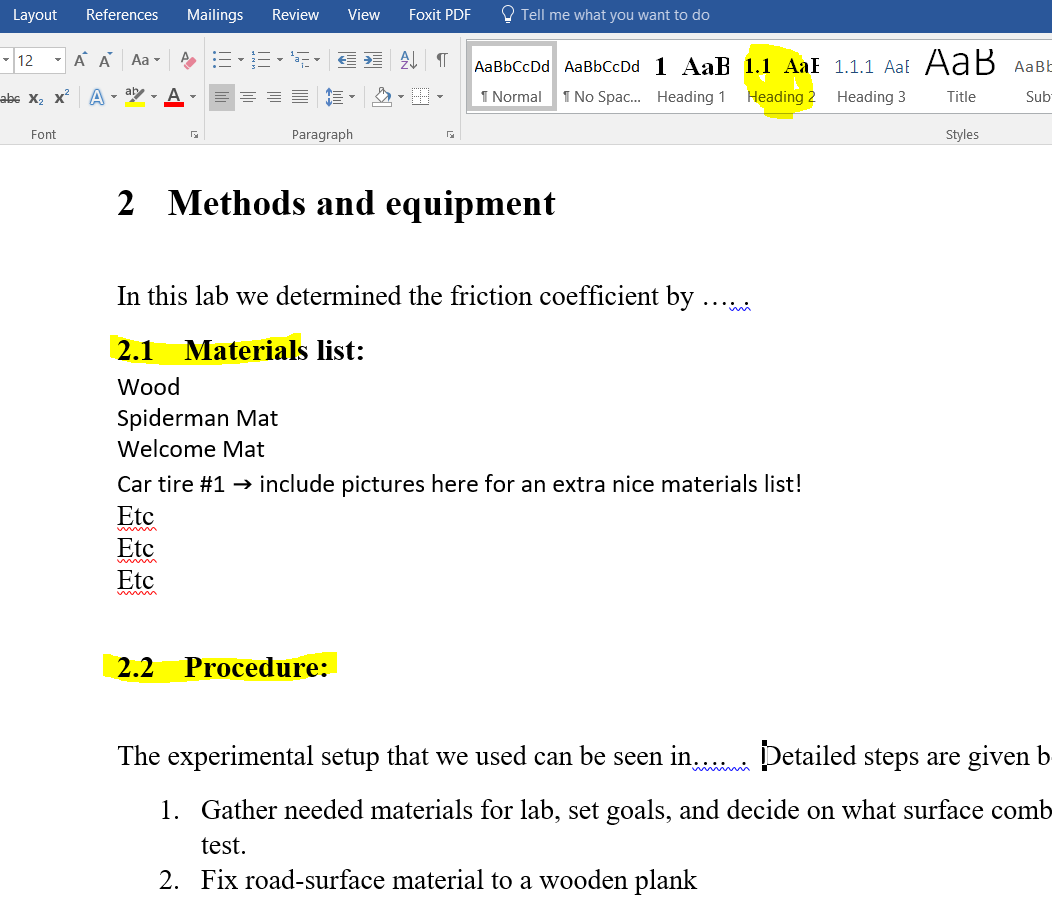
Once you have some text in there, right click on home→Heading 1→Modify
Headings should be black (so it can be photocopied) and bold.
Select "New documents based on this template" if you would like to save these settings for future papers.
Next, highlight a section name, and click "Heading 1"
Highlight the first section again, and select a numbering system.
right click on Heading 2→modify→choose the same font, bold, black color, etc.
Use numbered sections and subsections - just highlight your subsection, and click "Heading 2"
Figures
Cut and paste them in, then add a figure caption
right click on your figure → add caption→numbering→include chapter #'s
Your figure # will automatically update if you change heading numbers or rearrange anything. Include a short description under each figure:
All figures should be cross-referenced within the text. Cross references will also automatically update!
Insert → Cross Reference →reference type figure
Insert→equation
Add an equation number:
Reference→Insert Caption→Equ→numbering→
Cross reference your equations inside the text:
New equations will be numbered correctly as you continue to add them into your document.
Notice everything highlighted in yellow:
Each of the symbols in your equations should be clearly explained, and the use of each equation outlined.
Tables are labeled above the table, while figures and graphs are labeled below. Equations are labeled to the side.
Reference→add caption→Table→numbering→etc. as before.
Keep the same caption format throughout document.
Create histograms in excel - organize your data in tables and charts in order of largest to smallest, or smallest to largest.
All charts should have titles, and labeled axes.
Click on the chart, then "+" or paintbrush etc. to format it.
Use the snipping tool (don't cut and paste) to create a jpeg out of the chart, and bring it into word. Use "Figure" captions for charts and graphs.
References:
Use at least 3 or 4!
When you talk about it in the text, leave a little superscript number that corresponds to the reference section using "Insert Endnote"
Just for fun - end by adding a table of contents!
Click on a line after your title page, and before your introduction
References→Table of Contents
Split this work up - don't let one person assemble it all!!
If you get used to using these tools, it will make all of the labs and reports you do in the future much easier. I wish I had all of these tools when I was first writing up reports!!! (It's a real pain to go back and re-number everything by hand after you change something!!)


