Microsoft vs. General Motors
At a recent computer expo, Bill Gates reportedly compared the computer industry with the auto industry and stated "If GM had kept up with technology like the computer industry has, we would all be driving $25.00 cars that got 1,000 miles to the gallon.
In response to Bill's comments, General Motors issued a press release stating: If GM had developed technology like Microsoft, we would all be driving cars with the following characteristics:
1. For no reason whatsoever, your car would crash twice a day.
2. Every time they repainted the lines in the road, you would have to buy a new car.
3. Occasionally your car would die on the freeway for no reason. You would have to pull over to the side of the road, close all of the windows, shut off the car, restart it, and reopen the windows before you could continue. For some reason you would simply accept this.
4. Occasionally, executing a maneuver such as a left turn would cause your car to shut down and refuse to restart, in which case you would have to reinstall the engine.
5. Macintosh would make a car that was powered by the sun, was reliable, five times as fast and twice as easy to drive - but would run on only five percent of the roads.
6. The oil, water temperature, and alternator warning lights would all be replaced by a single "General Protection Fault" warning light.
7. The airbag system would ask "Are you sure?" before deploying.
8. Occasionally, for no reason whatsoever, your car would lock you out and refuse to let you in until you simultaneously lifted the door handle, turned the key and grabbed hold of the radio antenna.
9. Every time GM introduced a new car, car buyers would have to learn to drive all over again because none of the controls would operate in the same manner as the old car.
10. You'd have to press the "Start" button to turn the engine off.
A speaker gave everyone at a seminar a balloon, and told them to write their name on it. All the balloons were collected and put in another room, then everyone was asked to find their balloon. There were a lot of balloons, a lot of people, it was very hard for anyone to perform the task.
After some time of frustration, the speaker changed the task from finding your own balloon, to choosing a random balloon and finding the person whose name was written on it. Everyone just had to listen for their name being called out, within minutes everyone had their own balloon.
What is the moral of the experiment?

Projects -
Have you started construction? Is everyone working together?
10.9 Example engineering software packages:
Aspen
Simulates processes with continuous flow of material and energy. (ChemE - Petrolium)
https://www.aspentech.com/Company/About-AspenTech/

- Define the problem
- Specify material compositions (nitrogen, methane, steam, etc.)
- Insert heat exchangers, distillation columns, etc.
- Define flow rates, temperatures, pressures,
- Vary operating conditions to see pressures, temps, etc through system.
GIS
http://www.esri.com/what-is-gis
"Geographic information system (GIS) lets us visualize, question, analyze, interpret, and understand data"
http://storymaps.arcgis.com/en/

Virtual Instrumentation:
LabVIEW

https://www.youtube.com/watch?v=GBhJk5Tnshc
FEM - finite element

https://www.youtube.com/watch?v=lrpj3cZrKn4

.ANSYS
http://www.ansys.com/
http://www.reactiondesign.com/

SolidWorks
http://www.solidworks.com/

http://www.solidworks.com/sw/products/simulation/plastics.htm?scid=hp_tab_products_plastics
Inventor:

Working Model

http://workingmodel.design-simulation.com/WM2D/index.php
http://workingmodel.design-simulation.com/videos/DisplayDDMSE.php?id=14

http://www.algodoo.com/what-is-it/

CAD
Free student download!
http://www.autodesk.com/education/free-software/all

.
History of the Internet
Searching the Web:
List of TLD's
http://en.wikipedia.org/wiki/List_of_Internet_top-level_domains

Words of Warning:
Test: choose a random wiki page, and see how easy it is to edit it, but then see how long your edit lasts before someone else corrects it.
Just hit the edit button:

Type something in:
example:


Now open up the wiki page to see your edits!

But then, see how long your edit lasts - in this case, only a few minutes before someone else corrected it:

Create a Webpage:
If you have never created a blog before, try it out, create a blog for free on blogger.com, or wordpress etc. See how easy it is! A group blog could be a great place to combine, store, and share info for your team project!
10.3 Word processing Programs
10.4 Spreadsheets (Excel)
10.5 Mathematics Software
10.6 Presentation Software (Power Point) Learning new computer software:
As an engineer, and just as a person living in this century, you will constantly battle the need to learn new computer software.
Use online resources for learning software, and for learning everything.
Use youtubes, use wiki, use the program's website and help resources. Just open the program up, and play around on it until you get the hang of it.
Mathematica
online one-liner for Mathematica:
One of the computational software programs used in many scientific, engineering, mathematical and computing fields.
Invented by Stephen Wolfram and is developed by Wolfram Research of Champaign, Illinois.
- Mathematica 1.0 (June 23, 1988)
- Mathematica 9.0.1 (January 30, 2013)
.
Stephen Wolfram -
Married with 4 kids, PhD from Cal Tech physics department, was a child of Jewish refugees. His work in physics led him to create a computer program that solved, first algebra problems, then more complex systems. Eventually, he left academia to create his own company (Wolfram).
He is the author of "A New Kind of Science", a book where he theorizes that the universe is digital in nature, and runs on fundamental laws which can be described as simple programs.
He has now expanded his program to answer, not just math problems, but all kinds of questions. His work is used by Bling, Google, Siri, and Yelp's search engines.
He has many youtubes, including the TED talk:
https://www.youtube.com/watch?v=60P7717-XOQ Features of Mathematica include:
- *Elementary mathematical function library*Matrix and data manipulation tools*2D and 3D graphing*Solvers for systems of equations*Numeric and symbolic tools for discrete and continuous calculus*Multivariate statistics libraries
How to type formulas in:
Vertical cursor – type in existing section
Horizontal cursor – click to create a new cell
enter key – inserts new lines into cell
Shift+enter - computes results
(or “enter” on numeric keypad)
.
*** Mathematica "help" resources - Vertical cursor – type in existing section
Horizontal cursor – click to create a new cell
enter key – inserts new lines into cell
Shift+enter - computes results
(or “enter” on numeric keypad)
.
help - documentation center- 10,000 pages of info on all the functions with examples and tutorials on how to use them
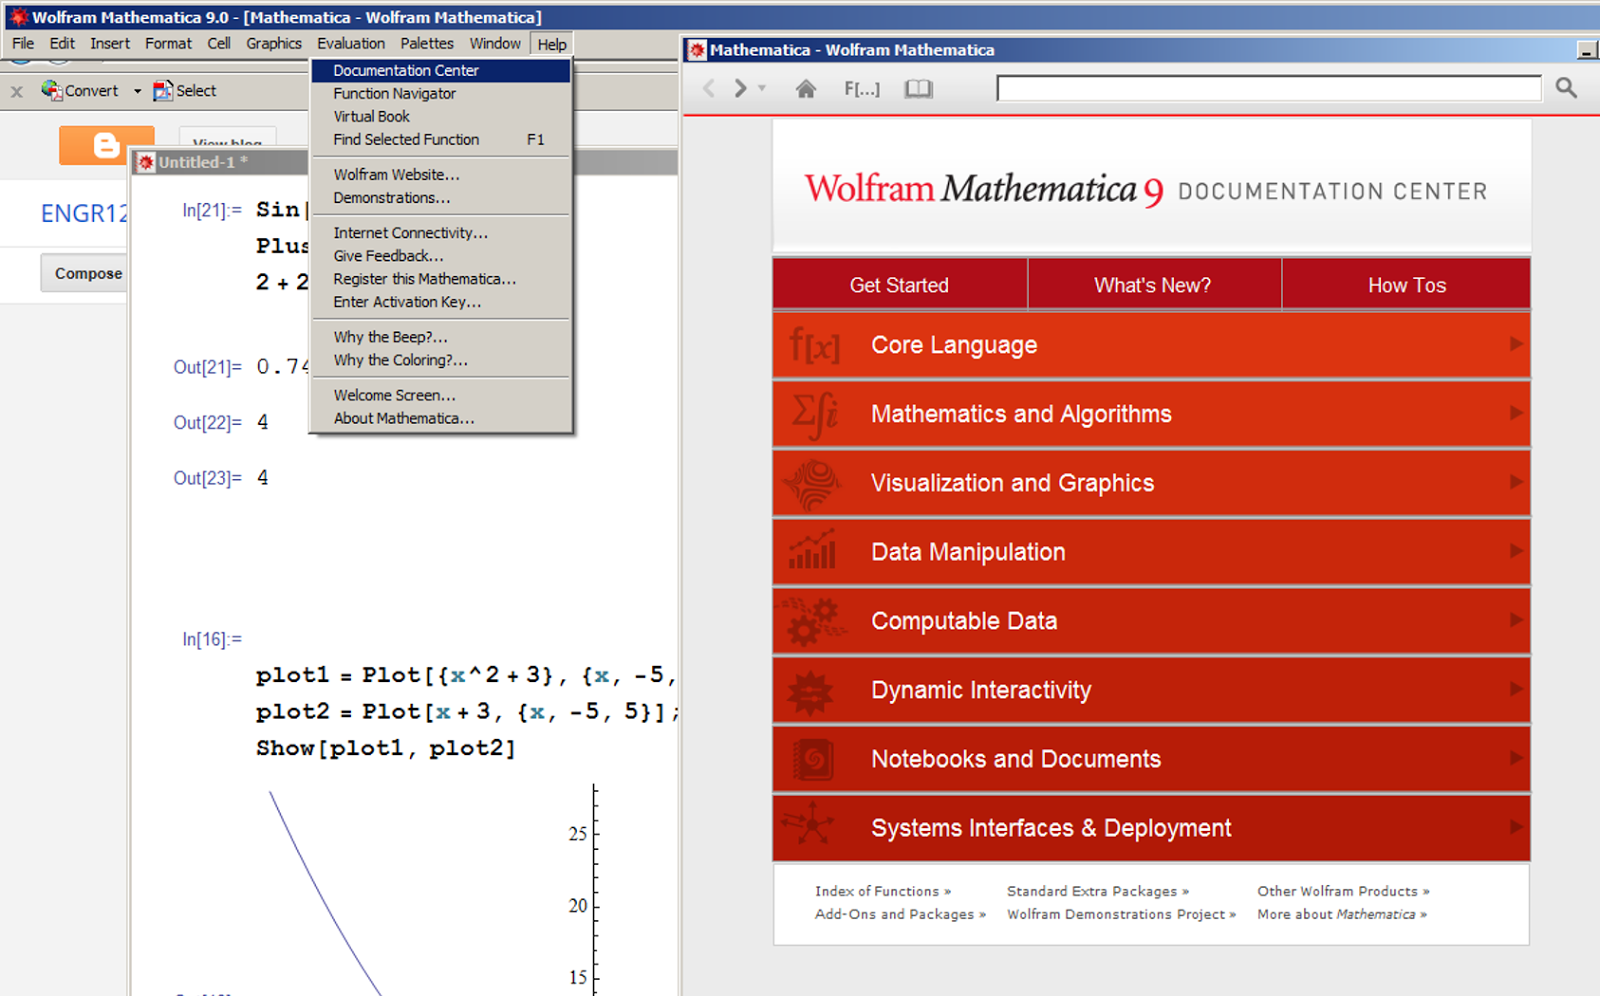
Check out:
*Visualizations and Graphics,
*Mathematics and Algorithms,
*Data Manipulation
Just type something in, cut and paste the examples out of the help - modify examples to do what you need to do.

help - Virtual book
Highlight function - help (or F1) - find selected function
type "?" followed by what you want help with:
?Plot - bring up Plot examples
?Plot* - everything that starts with plot
Plo... - edit, complete selection (ctrl - K)
Edit - make template - (Ctrl + Shift + K) - fill in basic structure of a function.


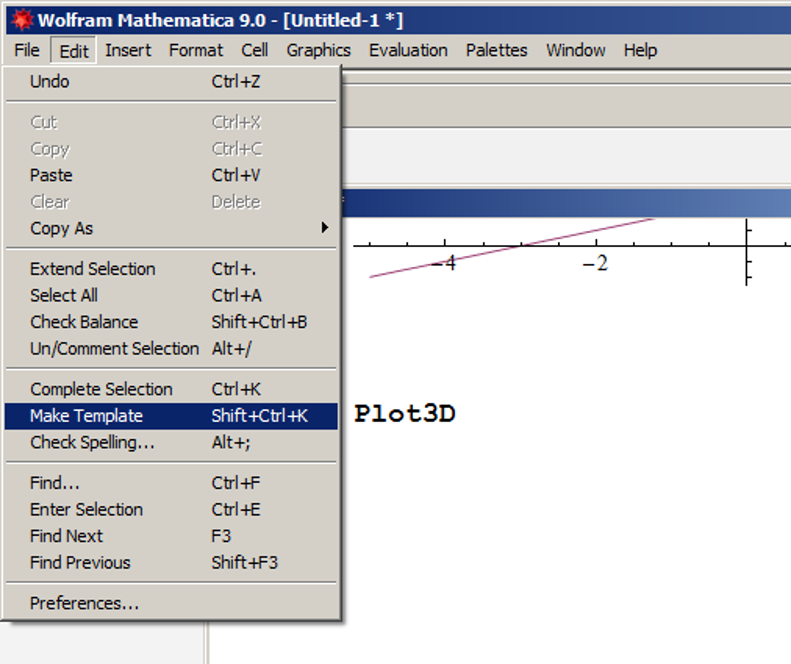
Fill in the values you need.


Pallets: Use to input formulas,
Start with the "Basic Math" pallet.
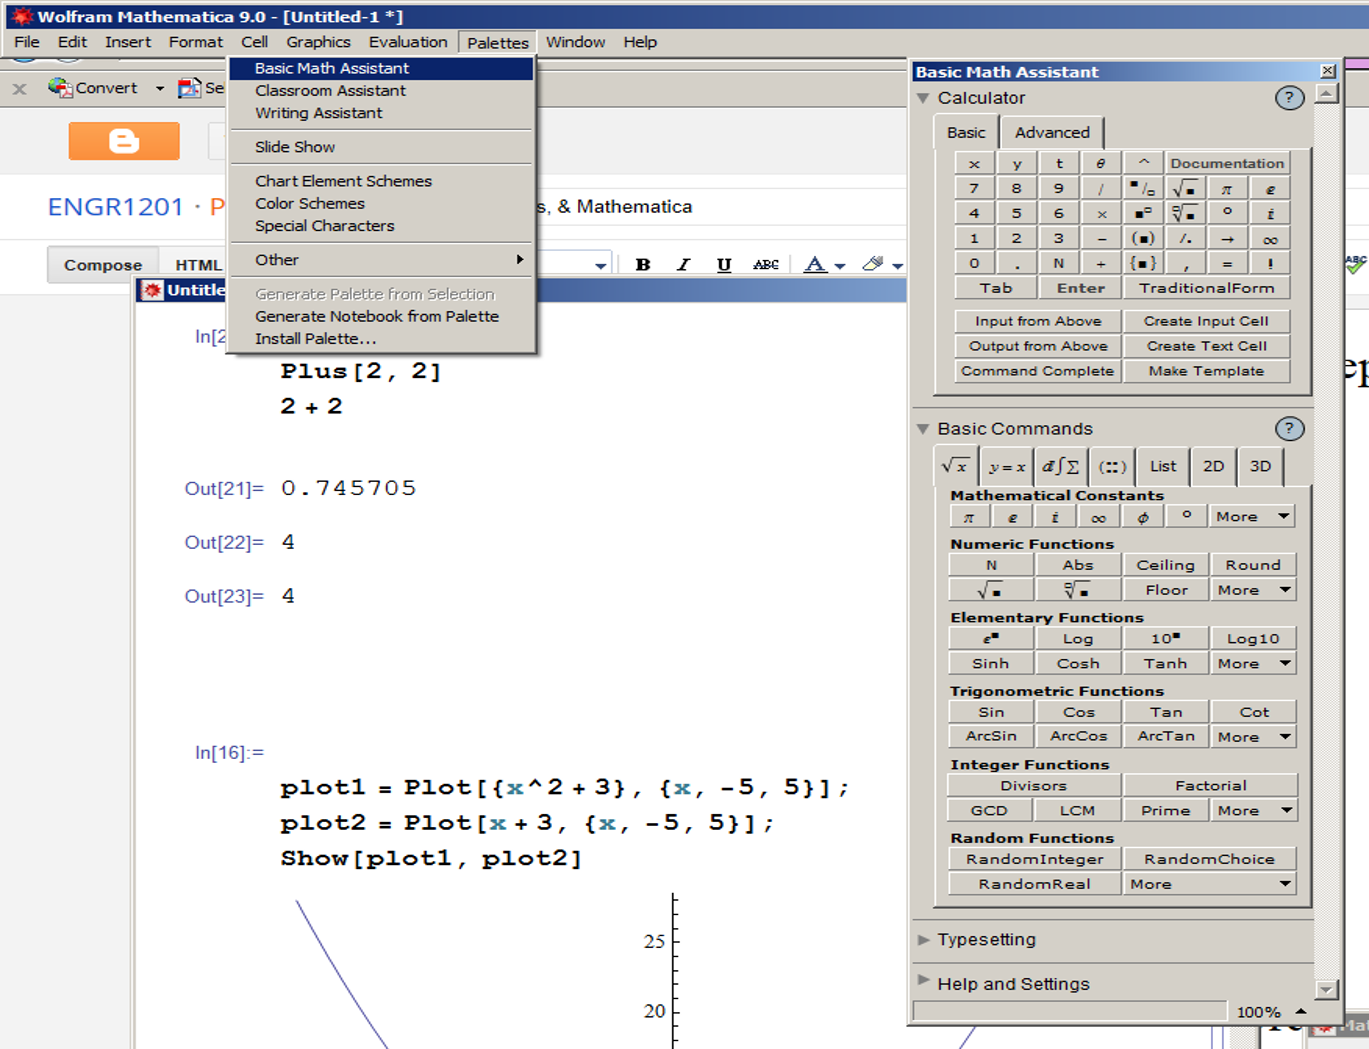

Function[square bracket, arguments separated with commas]
Plus[2,2] = 2+2

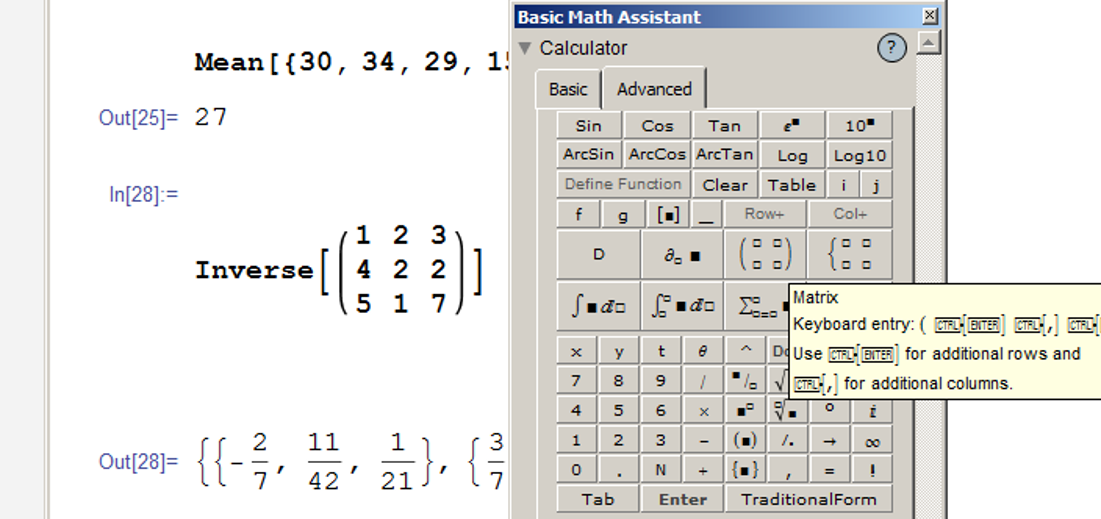
List and Matrix operations:
Mean[{30, 34, 29, 15}]
Inverse of 3 by 3 matrix:
Inverse[{{1st row}, {2nd row}, {3rd row}}]
Determinant:
Det[{{1, 2, 3, 4}, {5, 6, 7, 8}, {1, 7, 4, 3}, {1, 2, 3, 5}}]

m = {{1, 2, 3, 4}, {5, 6, 7, 8}, {1, 7, 4, 3}, {1, 2, 3, 5}}
m.m.m

Solve:
use "==" - two equal symbols
{{x-2}, {x-3}}
Solve[x^2+x+1==0, x]//N
//N - gives answer in numerical form
{{x-.5-.86i},{x-.5+.86i}}
Solve[a*x^2 + b*x + c==0, x]
x = quadratic formula
Solve system of equations - use {}
Solve[{3 x + 2 y ==15, 3*x - 3*y == 12}, {x, y}]//N

Numerical solution
(for problems you can't solve with algebra)
FindRoot[Log[x]==Exp[x]-5, {x,3}]
{x,3} 3 = num you start guessing with, it will find the solution closest to 3.
Plot[{Log[x], Exp[x]-5}, {x, 0, 2.5}]
intersection of two lines = solution
note - ln(x) = Log[x]

Solve[Sin[x]==.5, x]
- gives an infinite # of solutions:
Reduce[Sin[x]==.5,x]
Plot[{Sin[x], .5}, {x, 0, 6*Pi}]

Graphing:
Points:
ListLinePlot[{{1,2}, {3, 4}, {5,3}}]


Plot[Sin[x]/x , {x, -9.4, 9.4}]
Plot3D[Sin[x*y], {x, -Sqrt[3*Pi], Sqrt[3*Pi]}, {y, -Sqrt[3*Pi], Sqrt[3*Pi]}]
to rotate graph with mouse – just click on it with mouse
(Shift) + (move mouse) to pan around
(Ctrl) + (mouse) to zoom in and out.

ContourPlot[Sin[2*x*y], {x, -Sqrt[3*Pi], Sqrt[3*Pi]}, {y, -Sqrt[3*Pi], Sqrt[3*Pi]}]
Plot[Tooltip[{Sin[x], Sin[x]/x}], {x, -8, 8}]
Multiple plots on the same axis:
Plot[{Sin[x], Sin[x]/x}, {x, -8, 8}]
plot1=Plot[x^2+3,{x,-5,5}];
plot2=Plot[x+3, {x,-5,5}];
(; suppresses output)
Show[plot1, plot2]

Click on graph, then customize it with menu below it, or see everything you can do to it through:
Options[Plot]
Table[Plot[Sin[x]/x, {x, 0, 2 Pi}, Filling -> Top]]
AxesLabel→{“x”, “y”, “z”},
Mesh→None,
ColorFunction→Function[{x, y, z}, Hue[x x y]],
ImageSize→600
Plotrange→{{-0.25, 1.25}, {-0.25, 1.25},
PlotStyle→{{Dashing[0.5}, Black}, Black},
AspectRatio→Automatic,
Filling→{1→Bottom, 2→Top},
FillingStyle→{1→Directive[{Red, Opacity[0.5]}], 2→Directive[{Yellow, Opacity[0.5]}]}]
Frame→True,
Axes→true,
LabelStyle→{FontFamily→”Arial”, FontSize→24},
FrameLabel→{Time (s)”, “Displacement (cm)”},
PlotStyle→{Red, Thickness[0.01]}
Click and drag to make larger or smaller
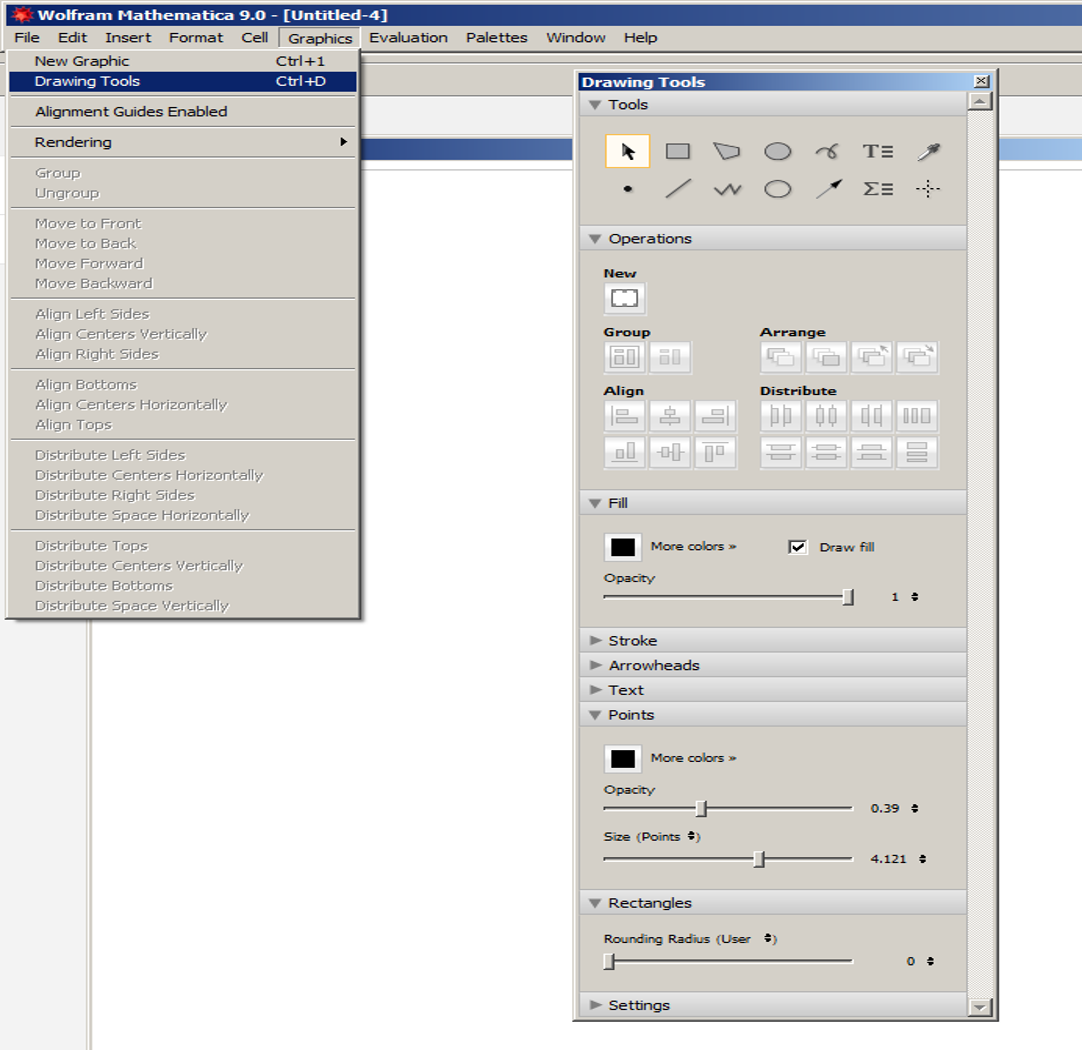
graphics – drawing tools – draw on arrow, text boxes, etc.
double click on curve to move it around, etc.
ListPlot

Plot a function:

Step-by-step + easy input:
Find a spot where the curser is horizontal
type == (two equal signs) shift enter


Chapter 17 - Math Review
Skim through chapter 17 for some example math problems to play around with. Use the Mathematica help center to search for tools that help you tackle some of the different problems from chapt 17. ******************************************************************************
ENGR1201 Mathematica Lab
Names:___________
1. (_____12 points) Look up 4 different functions in the help documentation center, copy and paste the function examples into a Mathematica file, execute them, and provide one sentence explaining what each function did.
Names:___________
1. (_____12 points) Look up 4 different functions in the help documentation center, copy and paste the function examples into a Mathematica file, execute them, and provide one sentence explaining what each function did.
2. (_____6 points) Create a 3 by 3 matrix, and perform an operation on it.
3.(____ 12 points)
a) Make a 2D graph of the following (x,y) pairs: (1,1), (2,4), (3,9), (4,16), (5,25).
b) Choose 3 editing tools out of Options[Plot] or menu below the graph to change the appearance of your graph.
c) Use “graphics” – “Drawing tools” to add arrows and text to your graph.
4. (_____8 points) Solve this system of linear equations
a) using the Solve[...] command, and
b.) by graphing both equations on a single plot and finding the intersection:
2x+y = 9, 3x - y = 16
5. (____/ 12 points) Solve one of the example problems from chapter 17 in your book using Mathematica OR solve one of or your current math HW problems.
6. (Extra Credit)
Make a 3D graph from an equation of your choice, print your graph, bring it to the front and tape it on the board, +5 points extra credit on test for the (class-voted) best 3D graph.
******************************************************************************
New features:
http://www.wolfram.com/mathematica/new-in-9/advanced-hybrid-and-differential-algebraic-equations/double-pendulum.html
Fractals:
http://www.bugman123.com/Fractals/
Certification:
http://www.wolfram.com/training/certification/students/
~~~~~~~~~~~~~~~~~~~~~~~~~~~~~~~~~~~~~~~~~~~~~~~~~~~~~~~~
r:=.5-Random[];
p=Array[{89 {r,r},r+.5}&,99];
Dynamic@Graphics[
Disk@@@(p={#2 #1+{r,r}+(1-#2)MousePosition["Graphics",#1],#2}&@@@p),
PlotRange44
]

~~~~~~~~~~~~~~~~~~~~~~~~~~~~~~~~~~~~~~~~~~~~~~~~~~~~~~~~~~~~~~~~~~~~~~~~~~
ParametricPlot3D[{Sin[u] Sin[v]+0.05 Cos[20 v],Cos[u] Sin[v]+0.05 Cos[20 u],Cos[v]},{u,-,},{v,-,},MaxRecursion4,PlotStyle{Yellow,Specularity[White,10]},AxesNone,MeshNone]

~~~~~~~~~~~~~~~~~~~~~~~~~~~~~~~~~~~~~~~~~~~~~~~~~~~~~
ComplexFnPlot[f_,range_,options___]:=Block[{rangerealvar,rangeimagvar,g},g[r_,i_]:=(f/.range[[1]]r+I i);
Plot3D[Abs[g[rangerealvar,rangeimagvar]],{rangerealvar,Re[range[[2]]],Re[range[[3]]]},{rangeimagvar,Im[range[[2]]],Im[range[[3]]]},options,ColorFunction(Hue[Mod[Arg[g[#1,#2]]/(2*Pi)+1,1]]&),ColorFunctionScalingFalse]]ComplexFnPlot[Gamma[z],{z,-3.5-3.5I,3.5+5.5I},PlotRange{0,4}]

GraphPlot3D[{12,23,34,41,45,51,25,35}, EdgeRenderingFunction(Cylinder[#1, .05]&), VertexRenderingFunction({ColorData["Atoms"][RandomInteger[{1,117}]],Sphere[#1, .15]}&), PlotStyleDirective[Specularity[Yellow, 20]]]
