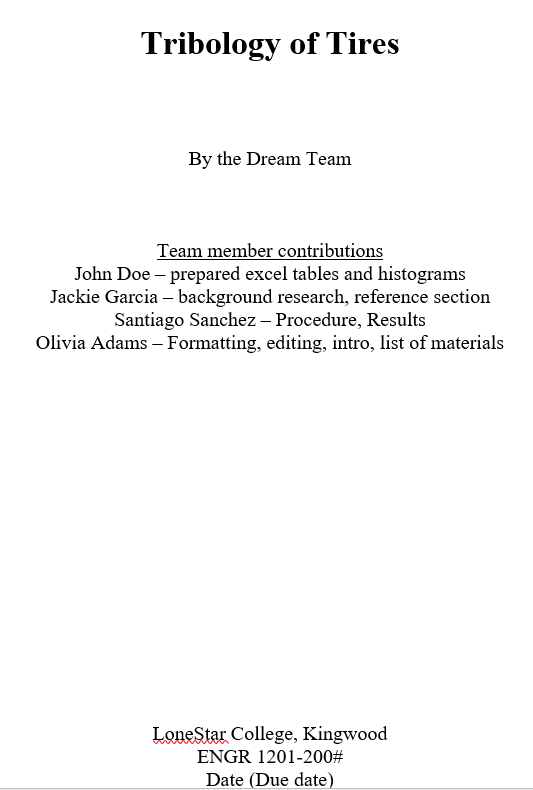
Pages

Example Technical Paper

The exact format for technical reports vary from company to company - but you should at least be familiar with some basic tools in word, and general formats.  

Start with: 

  • Title, 
  • names of authors, 
  • the institution, 
  • date   

Some reports require an entire title page, others just a header - usually the above information will be needed though.

for 1201 → list the contributions of everyone in your group.

example title page:

Font: Times New Roman, 12 pt or something similar.  
Margins: 1" bottom, 1" right
Page numbers:
insert → page number→top, right

Click next to the page number, and look through options in the deign tab.  Add the title of your report as a page header by typing it in, and then hitting tab to get it to the corner.


Select "Different First Page" in the design tab to hide the header in the first page.  


Hit "Esc" to exit out of the header.  Double click on the header to quickly edit it.

Type in a few sections without worrying about formatting yet:

Introduction, Methods and equip, etc.  
Once you have some text in there, right click on home→Heading 1→Modify


Headings should be black (so it can be photocopied) and bold.  

Select "New documents based on this template" if you would like to save these settings for future papers.  

Next, highlight a section name, and click "Heading 1"
Highlight the first section again, and select a numbering system.


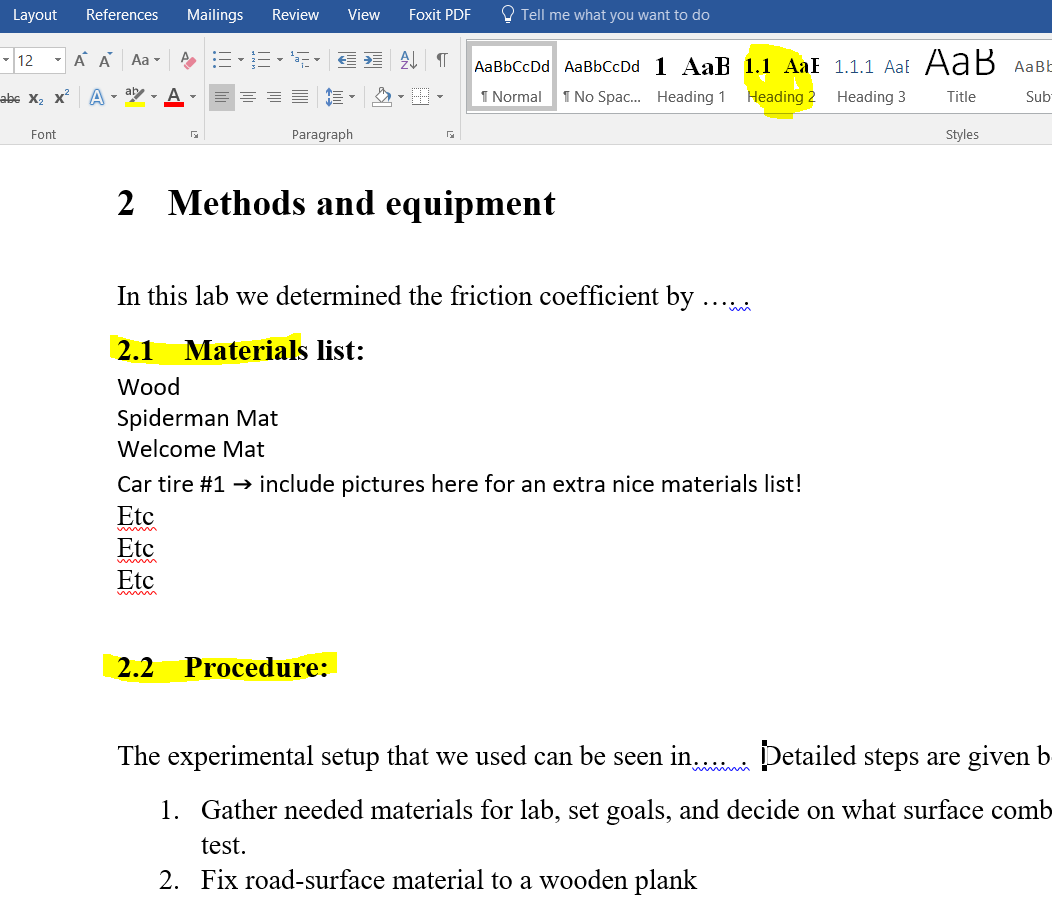
right click on Heading 2→modify→choose the same font, bold, black color, etc.


Use numbered sections and subsections - just highlight your subsection, and click "Heading 2"


Figures
Cut and paste them in, then add a figure caption

right click on your figure → add caption→numbering→include chapter #'s


Your figure # will automatically update if you change heading numbers or rearrange anything.  Include a short description under each figure:


All figures should be cross-referenced within the text.  Cross references will also automatically update!

Insert → Cross Reference →reference type figure

Insert→equation


Add an equation number:
Reference→Insert Caption→Equ→numbering→


Cross reference your equations inside the text:

New equations will be numbered correctly as you continue to add them into your document.

Notice everything highlighted in yellow:


Each of the symbols in your equations should be clearly explained, and the use of each equation outlined.  

Tables are labeled above the table, while figures and graphs are labeled below.  Equations are labeled to the side.

Reference→add caption→Table→numbering→etc. as before.
Keep the same caption format throughout document.


Create histograms in excel - organize your data in tables and charts in order of largest to smallest, or smallest to largest.  

All charts should have titles, and labeled axes.


Click on the chart, then "+" or paintbrush etc. to format it. 

Use the snipping tool (don't cut and paste) to create a jpeg out of the chart, and bring it into word.  Use "Figure" captions for charts and graphs.

References:
Use at least 3 or 4!  
When you talk about it in the text, leave a little superscript number that corresponds to the reference section using "Insert Endnote"


Just for fun - end by adding a table of contents!
Click on a line after your title page, and before your introduction
References→Table of Contents


Split this work up - don't let one person assemble it all!!


If you get used to using these tools, it will make all of the labs and reports you do in the future much easier.  I wish I had all of these tools when I was first writing up reports!!!  (It's a real pain to go back and re-number everything by hand after you change something!!)


excel basics

Notes on Excel
Excel has sheets along the bottom - just click on a tab to see a new page, double click on the tab to rename it.


Tools along the top like word  ppt / CAD.


If you leave your courser over a button it will come up with a short description of what it is and what it does - click on the "?" to get more directions for use.  


Use it just like a calculator - type "=" to calculate something!

Example table for taking data set up in excel:

Each table has equ's entered to calculate averages, StDEV's, friction coef:

Equ's entered into table:


Use big bold font for headings
Add borders to cells, thick borders around Titles.
Center your text in the cells.
Set your precision (the number of decimals displayed) etc.

Don't forget to list the units you are using!


Printing:
I like to format everything for the printer right from the start so I don't have to re-size everything later.


Re-size columns and rows so you can easily see data, and so your table is centered on your page:

Clicking on the upper left hand corner highlights all of your cells so you can format everything (like the font size, and precision) together:


You can also select individual columns and rows to format:


Same thing with columns, just click on a column (A, B, C) instead of a row.

Change the cell color if you want:


Entering equations:

Create a table for your constants, rename the cells
c6→so
c7→vo
c8→ao

Just highlight the cell name, and type a new name into it.  When you are referencing this value in your equation, you can now use a variable name, instead of a cell name. 


Type in your equations:
Think of it just like typing something into your calculator.

Highlight a cell, start with "=" and tell it what you want to do.

Notice the color coding to keep track of what cells are in your equ.


Once you have an equation in one cell, you can copy it down to the other  cells - just select the cell you have, grab the green square in the lower right hand corner, and drag it down.

Cells that you have renamed (like dt) will not change their value when you copy your equation down.

If you did not rename your cell, but you want it to be the same, use dollar signs.

$C$11 - will keep C11 through all calculations.
$C11 will keep "C" the same, but 11 will change to 12, 13, 14 etc. as you copy it.

Note the F4 key is the shortcut for adding dollar signs.
put your curser over the cell name in your equation
Hit F4 once for two dollar signs ($C$11)
Hit F4 again and again for other combinations ($C11, C$11, C11)
Graphing Data:
Highlight your entire table (including the titles t(sec), distance (ft), v(ft/sec), etc...

Graphs
Insert →Chart→Scatter (xy) chart

Excel creates a default graph with 3 data sets (distance, velocity, and acceleration) all graphed against time.

Let's make three separate graphs, instead of one graph.

Copy the graph to make three graphs:
select graph, Ctrl+C, then Ctrl+V to paste.

You can select and delete lines off of each graph so that you are left with only one line per graph:


Now we need to get rid of the legends, and add axis labels
x→time
y→distance, vel, acceleration etc.

Just select a graph, and click on the (+) to add axis titles.
Click on the paintbrush too to see editing tools there!

Label all of your graphs correctly:


For your Mousetrap Car data, you will need to add a trend line to your graph.

Just select your line, right click on it, then select "add trendline"


If you select the trendline, there is a menu to let you display the equation, select what kind of a fit, etc.


When data is not perfect, it is better to calculate Vel and Acc off of a nice smooth trend line.  Engineers use trendlines a lot!

Note,
R-squared = the coefficient of determination (a measure of how well the model fits the data). Perfect fit → R-squared = 1.
horrible fit →  R-squared = 0

If you want, break your line up into two lines, one that is 0>t>4, and one for 4<t<10.  Fit two different lines.  times above 4 should fit perfectly to a linear line.

Note: Do you have a different version of Excel?
Just youtube it to figure it out!!
Youtube → search "How to create a graph in Excel 2009" etc.

Think of it like driving cars - once you can drive a Toyota, you can drive a Honda too, the basic ideas in all of the versions are the same, you just have to find where they moved all of the buttons to.


Don't forget to save your work often!  
If you forgot your USB drive, just email your work to yourself - save it via email.