Pages

Exp Design

 Purpose of experimentation:

 - create higher quality products at lower cost.


What is an experiment?
Change in Input  → Process →  change in output

Process → machines, materials, methods, people, environment, measurements

What are the important input factors, and how do they influence the output?

1) Improve performance characteristics:
          Identify critical factors
          Reduce scrap and rework
2) Reduce costs
3) Shorten production development time

Example system input and outputs for product optimization:


What is experimental design?
Using efficient and effective experimentation procedures to get the most information you can the fastest you can.
Most efficient way to collect data?
.
.
Use historical or happenstance data
AKA, just use what is already out there.
 
Risks – undocumented/unknown factors present in non-experimental data.
Example:  
Does changing temp in wire bonding process increase the number of defects in the product?
Undocumented factor: 
Lab operator was changing the standard temperature settings without recording altered temperatures.
.
.
.
Change one factor at a time.
example:
Hold Pressure constant, just change temperature. 


Hold temperature constant, just change pressure.


Do the above tables contain all possible combinations of (T,P)? 
No (P2,T1) is missing.
What about interactions between factors?
Example: Testing the effects of heart medication and grapefruit juice on health.  (Cannot test grapefruit juice independently of medication, as they interact with one another) 

If factors interact with one another,
one-at-a-time testing is inadequate to determine results.
Combination of (P2,T1) is not contained in the one-at-a-time tables.    What if (P2,T1) provides the optimal result?


Full Factorial Design
Test all possible combinations of input factors

-         Works well if there are only a few input factors
-         Impossible if there are many input factors


Example – what if there are 12 different input factors?

12 input factors, each tested at two different values


(T1, T2, P1, P2, % C1, %C2, etc.)


2^12 combinations = 4096 combinations to test! impossible!

Robust Design:

  • Eliminate testing factors that cannot be changed or controlled.
  • Use statistical tools to determine the most important combinations to test.
.
    Planning your experiment:

    State specific goals

    Example experiment goals: 
    analyze o-ring materials for use in rocket booster seal.  Quantify temperature and loading-rate dependence of material strength properties.

    Gather background information through research and meetings

    Meet with
    • Management,
    • engineers,
    • subject matter experts,
    • operators, 
    •  analysts
    List inputs
    • type of rubber
    • temperature (room temp, freezing, and room temp)
    • loading rate
    • age of rubber
    • exposure (sun, humidity)
    • other treatment options

    List of outputs
    • yield point, 
    • young's modulus, 
    • shape of stress strain curve
    • friction coefficient


    Example Objective:
    • Define safe operating temperatures and pressures for o-ring seals
    How will inputs be measured?
    Create stress-strain diagrams for rubber which shows strength properties as a function of temperature
    How many levels per input?  

    possible experiments to run:
    Create stress-strain diagrams for 3 different temperatures (frozen, room temp, 100°C)
    Test multiple types of o-ring materials
    Test old and new o-rings to quantify how properties change with time
    test under different pressures
    How important is each factor?

    .


     *1.18 Tree diagram
    *1.4 Design Matrix Table
    Conducting the experiment:
    •  Adhere to clearly defined and agreed upon operating procedures
    • Prepare data sheets in advance 
    • Repetition & error tolerances
    • Analyze data, Draw conclusions, make predictions, do confirmatory tests
    Causation vs. Correlation
     
    1. A causes B
    2. B causes A
    3. A and B are both consequences of the same cause
    4. Some combination of 1, 2, and 3
    5. A and B unrelated, correlation is pure coincidence.
    http://www.fromquarkstoquasars.com/correlation-vs-causation/
     

    Taking Data:
    • Repeat each measurement 4 times
    • Compare the data you get to the data others get - is it repeatable?  
    • What is the error in measurement? 


    Uncertainty Analysis:  
    Errors in Physical Measurements
    • X = True Value
    • xi = measured value
    • n = number of measurements taken
    • Accuracy = how close xi is to true value X
    • Precision = how good grouping is
    Good accuracy poor precision -                                       Bad accuracy, good precision


     Mean:


    • Median = midpoint in events (½points below, ½ points above)
    • Mode = most frequently occurring value

    • Error = ei = Deviation from true value: ei = xi - X
      • We do not (and cannot) know X - so - Approximate X by the mean µ
      • ei* = xi - µ
      • ei* approximates ei and is called an estimator of ei.
      • Random deviations: Human errors, normal distribution
      • Systematic deviations: Calibration errors

    • Relative Error = DX/X -or- = ei/m
    • Variance


    • Standard Deviation = width of distribution, estimate of average error


    • Standard Deviation of Mean (SDOM)


    xi = each individual data point
    u = mean
    N = number of data points

    Gaussian (Normal) Distribution, 
    or common probability distribution.  
    (Take a bunch of data, probability that data will fall within a certain range)
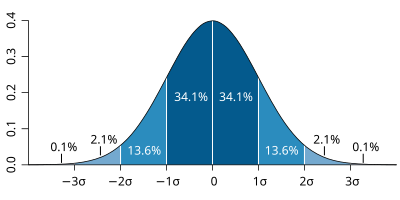


    Example of different distributions taken with different precision -


    File:Standard deviation diagram.svg 
    • low standard deviation = data points very close to the mean
    •  high standard deviation = data points spread out over a large range of values.
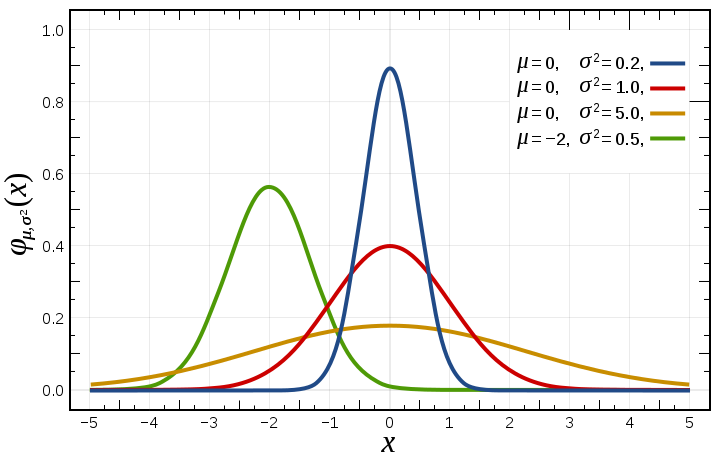
    File:Normal Distribution PDF.svg


    Project: 

    • Review technical communication notes, 
    • Walk through engineering method, 
      • Problem statement, Goals, Research, .... testing
    • Experimental Design: Materials list, procedure, data sheets,

    Experimental design: test project build

    • Testing:  Construction,  fill in data tables, graphs, error analysis
    • Conclusion, review, and recommendation for further tests.

    Data sheets in excel
    Tables should have
    • Place to record all inputs 
    • Copies of tables to record multiple trials - repeat each measurement at least 4 times
    • Standard deviation, mean, mode for repeated trials
    • Room for additional notes and comments.
    • Graphs comparing results
    • Conclusions:  is design safe? energy efficient? what modifications could be made?  Your project build will be just a model, in report include notes on what materials and design you would use if given more time and resources.

    Mechanics & Wind Turbine!

    Two major divisions of Mechanics:
    1. kinematics
    - study of motion without reference to the forces causing the motion using mathematical relationships:


    2. kinetics
    - relates forces to motion


    Newton's Laws of Motion:

    1st law: 

    A body in motion tends to stay in motion.


    A body at rest wants to stay at rest.


    ie - things want to keep doing what they are doing, you have to apply a force if you want it to change what it is doing.


    Inertia = the resistance of any physical object to any change in its motion


    2nd law: Force = Mass * acceleration

    The acceleration of a particle is proportional to the force acting on it and inversely proportional to the particle mass; the direction of acceleration is the same as the force direction.


    Large m, Large F.... small F, small m

    F = ma


    Constant acceleration

    3rd law:

    The forces of action and reaction between contacting bodies are equal in magnitude, opposite in direction, and co-linear.


    Law of gravitation:
    The force of attraction between two bodies is proportional to the product of their masses and inversely proportional to the square of the distance between their centers.


    Many STEM classes revolve around Newton's laws, and understanding how best to control and use forces.

    Free-Body Diagrams


     A sketch or picture of the problem


    Free Body Diagram, FBD
    A sketch showing the forces on point "A" in the above problem:


    Forces are represented by arrows.  Notice this arrow, or vector, has two important pieces of information:
    1. The direction
    2. The magnitude (length).


    Rectangular Components of a Force: Unit Vectors
    rectangular vector components


    ..
    unit vectors


    scalar components Fx and Fy


    Common Forces:

    Spring Force:


    Wind drag:


    Voice and Data Communications and Their History

    Thank you to Jerry Reasner from "Texas Emergency Amateur Communicators"
    https://www.teac.net/  for putting together this timeline!


    The History of Sending Information

    Since recorded history, there has been a need to send messages from one location to another location.
    • Runners

    The first marathon commemorated the run of the soldier Pheidippides from a battlefield near the town of Marathon, Greece, to Athens in 490 B.C. According to legend, Pheidippides ran the approximately 25 miles to announce the defeat of the Persians to some anxious Athenians. Not quite in mid-season shape, he delivered the message "Niki!" (Victory!) then keeled over and died.

    • Smoke and Fire Signals
    Great wall of China: Due to its length, the Great Wall of China could not have men along every inch of its ramparts at once watching out for the Mongols, Turks, Tungnu, and Xiongnu. Even with nine Zhen (military districts) covering the 4100 mile length between the First and Last Doors under Heaven, the defenders held true to Sun Tzu’s adage “He who defends everything, defends nothing.” To prioritize their defense, the Chinese created a method to alert garrisons where attacks were in progress. This took the form of a firelight defense system within the watch towers. The Great Wall of China was defended with communication - by watchful eyes, a system of signal fires, lights, and flags, and an army of brave, dedicated, observant men who were quick on their feet.

    Misuse of the smoke signal is known to have contributed to the fall of the Western Zhou Dynasty in the 8th century BCE. King You of Zhou had a habit of fooling his warlords with false warning beacons in order to amuse Bao Si, his concubine.

    The Crusades 1095 AD: the need for communications between outposts was very important.  Bonfires were built on top of castles which were built on top of mountains.  Fires signaled other outposts of incoming invaders.

    The North American indigenous peoples also communicated via smoke signal. Each tribe had its own signaling system and understanding. A signaler started a fire on an elevation typically using damp grass, which would cause a column of smoke to rise. The grass would be taken off as it dried and another bundle would be placed on the fire. Reputedly the location of the smoke along the incline conveyed a meaning. If it came from halfway up the hill, this would signify all was well, but from the top of the hill it would signify danger.

    Smoke signals to indicate the selection of a new Pope 

    Military colored smoke grenades used to mark positions.

    • Horse and rider

    In the mid-19th century, California-bound mail had to either be taken overland by a 25-day stagecoach or spend months inside a ship during a long sea voyage. The Pony Express, meanwhile, had an average delivery time of just 10 days..

    The Information Age

    • Telegraph – the transmission of written words by using Morse Code, one letter at a time over copper wire to send messages.  

     1851: The Morse system was officially adopted as the standard for continental European telegraphy  


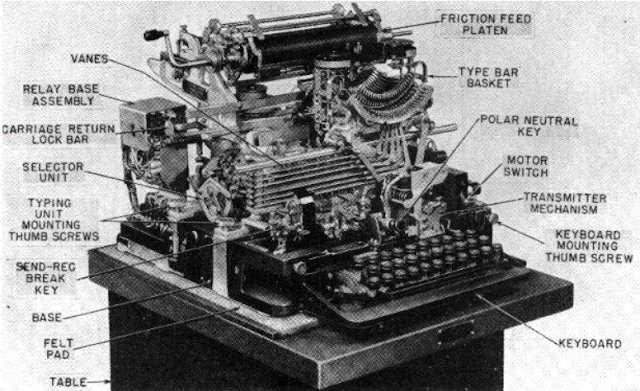
    Teletype using the Baudot five bit signaling code.


    Mores code sent messages one letter at a time with an individual using a telegraph key.  The teletype sent one letter at a time, but did so automatically by typing on a key board.

    Telegraph Key &World war II Teletype machine

    Information Age Hero's


    • Nikola Tesla – Pioneer in AC Power Distribution, etc.

    • Thomas Edison – Great inventor, light bulb, phonograph, movie camera, etc. 

    • Benjamin Franklin – Lightning Rod, bifocals, franklin stove, glass harmonica, etc.
    • Guglielmo Marconi – Pioneer in long distance radio transmission.

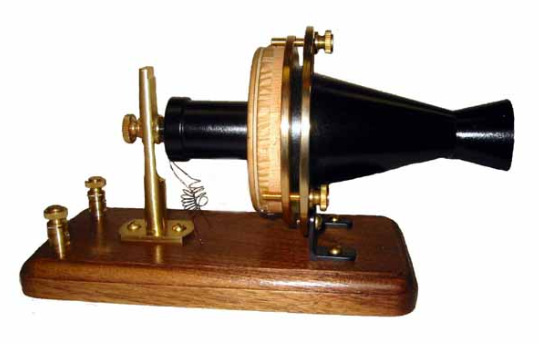
    • Alexander Graham Bell – Invented the first practical telephone.

    The First Telephone Call. What were the first words ever spoken on the telephone? They were spoken by Alexander Graham Bell, inventor of the telephone, when he made the first call on March 10, 1876, to his assistant, Thomas Watson: "Mr. Watson--come here--I want to see you."
    • Samuel F. B. Morse – Inventor of the telegraph.


    Voice and data networks until the 1950’s and 1960’s. 


    •  Voice and data networks would stay separate networks until the 1950s and 1960s.  
    • Modems were invented which used the same basic telephone lines as voice calls, but with different telephone company interface cards.
    • The term Modem = Modulation – Demodulation 


    First Telephones


    When a patch cord was inserted in a jack,  the operator could use one of the keys on the board to cause a ring signal to go the telephone.  In the beginning, many of the telephone lines were on party lines.  Those are lines with more than one telephone on a line.  The operator would ring short and long rings or a combination of these rings for the person who the call was for.  It was common for someone else on the line to pick their phone up when they heard it ring and listen to the conversation.  And some times put their own “2 cents worth”.


    The years since the first modems and telephone lines have brought us to high speed digital lines to our homes and WIFI to our computers.

    Data

    The advancements in technology that took place from the late 1950s to the present are more than anyone could have ever dreamed would happen.  The technology advances took us from big centralized computers to distributed computing and from slow copper wire distribution systems to high speed systems that utilize both wired and RF distribution system.  Ethernet started out with large cables and transducers and migrated to very fast Gigabyte wired, and wireless WIFI systems.  

    Voice


    In the world of voice we went from yelling at each other over old crank type telephones to the sophisticated telephones phones of today.   We now have voice calls being sent from a smart phones, digitally through central offices to another smart phone.  In reality,  from your small pocket computer to a another small pocket computer on the distant end, where voice is just an application on your small pocket computer.  Did you notice the phrase, “small pocket computer”?